


Training Log #2: Training data analysis for the 3rd okumusashi long trail race
In this post, I will introduce my training data, focusing on Heart Rate (HR) Zones. This data covers the period from the 2nd Okumusashi Long Trail Race to the month before I finished the 3rd race.

I use the POLAR Vantage V3. All the data was exported from the official application, Polar Flow.
Annual Running Distance
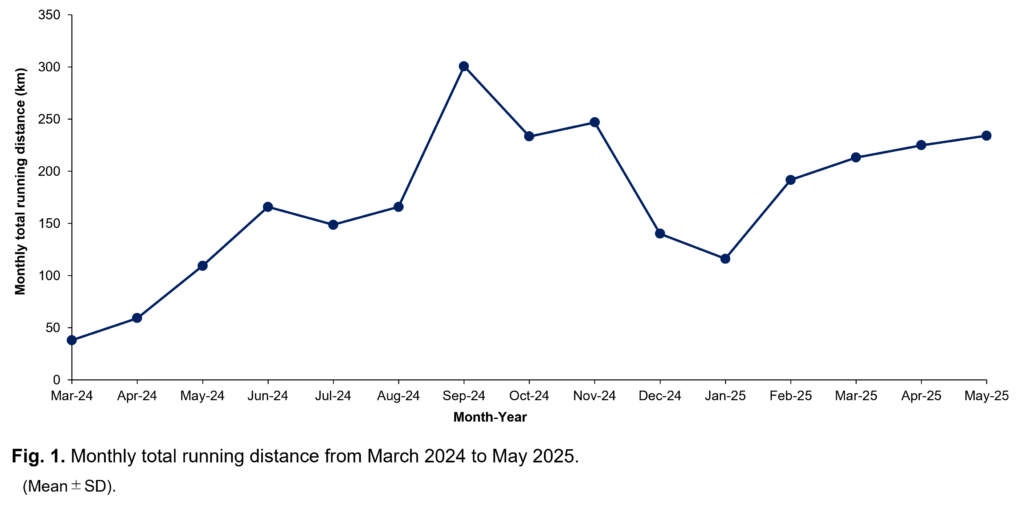
Fig. 1 illustrates the monthly total running distance from March 2024 to May 2025. Between September and November 2024, the monthly distance reached 250 km. Additionally, the distance exceeded 200 km per month from February to May 2025. The data indicate that the longest running distances were recorded during the period from autumn to spring in Japan.
I am a full-time worker, so I train after work during the weekdays. Usually, I run for 1 to 2 hours on weekdays and go for a 30 km long run on weekends.
Analysis of Training Intensity and Heart Rate Zones
Analysis of Monthly Training Intensity and Heart Rate Zones
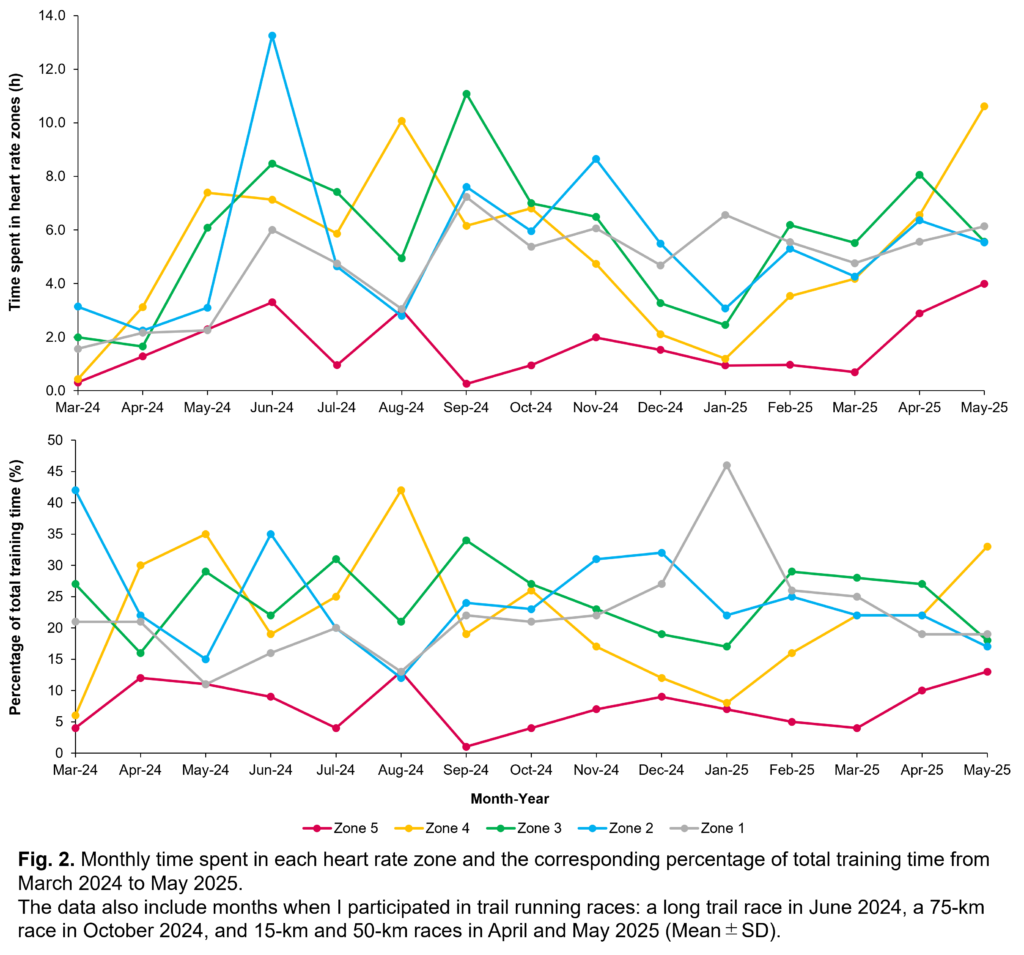
Fig. 2 illustrates the total time and the percentage of time spent in each heart rate zone monthly. The profiles for both metrics are very similar.
Notably, the profiles of Zone 3 and Zone 4 are consistent with the monthly distance data (Figures 1 and 2). This indicates that the majority of my training time was allocated to these two zones. Furthermore, the time spent in Zone 5 remained almost constant, even when the total distance increased (Fig. 2).
As a full-time worker, my training time is limited, and it is essential to avoid illness or injury. Therefore, my monthly limit for Zone 5 is estimated to be approximately 2 hours. In May 2025, the time in Zone 4 increased significantly due to my participation in a 50 km trail race (Fig. 2). It is likely that runners who participate in races every month spend more time in Zone 4 than I do.

Spring in Japan is refreshing, and running under the cherry blossoms is a wonderful experience.
Weekly Training Distribution

Fig. 3 illustrates the total time spent in each heart rate zone per week. As a full-time worker, I train after work during the week and perform a 30 km long run on weekends. Although the duration in Zone 2, Zone 3, and Zone 4 fluctuated, the average time for each was relatively consistent.
On average, approximately 1.5 hours per week were spent in each of these zones (Fig. 3). This suggests that balancing the time for each zone, including walking, may be a key factor for a sustainable training plan. However, the standard deviation for Zone 2 was higher than for the other zones, likely due to the varying duration of walking in each training session.
I am a full-time worker, so I train after work on weekdays and go for a 30 km long run on weekends.

Summer is humid and difficult to endure, but running on sunny days still feels great.
Progress in Running Index
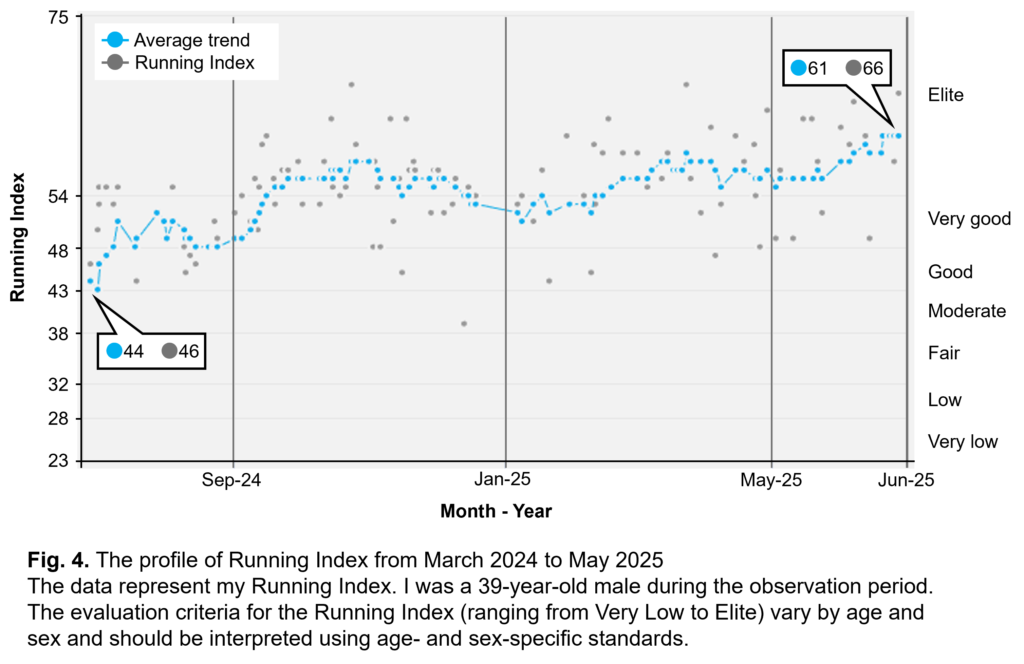
Fig. 4 illustrates the progress of the Running Index throughout the year. Overall, there was a clear upward trend in the data.
Initially, the index was 44, but it increased to an average of 61 by June 2025 (Fig. 4). This suggests that the training was performed with an appropriate exercise load, even while balancing professional responsibilities as a full-time worker.
Autumn and winter become very cold, but I wore warm clothes and continued my training.
Increasing the time in Zone 3 and Zone 4 may have helped increase my total running distance.
The time spent in Zone 5 remained almost the same throughout the year.
The weekly time spent in Zone 2, Zone 3, and Zone 4 was very balanced, with each zone accounting for about 1.5 hours.
Through this training, my Running Index successfully reached 66, which may show that my training approach was effective.
References (Polar Official)
About Heart Rate Zones
https://www.polar.com/en/guide/heart-rate-zonesAbout Running Index
https://support.polar.com/en/running-index?utm_source=chatgpt.com